cintoo-logo

Made For Scale:

What Doing More With Your Data Really Means


Moving Beyond Digital Adoption

The new challenge facing enterprises, particularly those responsible for complex industrial facilities, infrastructure, and asset-intensive environments, is how to scale digital adoption in a way that delivers sustained, measurable value. 

At this stage, enterprises are often rich in data but that, in and of itself, can be overwhelming. Laser scans, BIM models, IoT streams, maintenance records, P&IDs, and inspection reports exist in siloed systems that act more like black boxes. The promise of “doing more with your data” is frequently discussed but rarely defined. 

To remain connected and competitive, enterprise scalability requires: 

A shared, reality-based operational framework that transforms data into actionable intelligence. 

This is the shift from visualization that underscores all aspects of the operational digital twin.
In this eBook, we’ll walk you through the fundamentals.
 

Redefining Enterprise Scalability

Scalability has to begin with a single, trusted representation of reality, built on the foundation of reality capture data. The crucial aspect to remember when building out this single source of truth is operational connectivity. Once this becomes defined as a strategic objective, there is no limit to how enterprises can scale.

In the following text, we’ll outline the most important criteria for building this. 

What Makes a Digital Twin Operational?

feture-intro-1 1 (1)
code border

Documentation such as manuals and P&IDs
2d3d border

Structured asset intelligence

clock border

Maintenance and inspection versioning history / archival data

scan2bim border

High-fidelity scan data

graph border

Analytics and insight-driven dashboards

iot border

IoT data / performance data

When these layers can coexist in a single environment, teams no longer have to leave one system to find answers in another – all of it remains connected and the twin becomes the infrastructure for operation-driven insight instead of just 3D viewing.

The foundation of truth, built on reality capture data from a variety of scanners, is best utilized when easily ingested and streamed in a web-based browser. The accessibility and toolsets available make it easy to attain:

world-icon-image

Consistent asset understanding across teams and geographies  

cross-functional

Cross-functional collaboration without rework or data loss  

blue-tick

Faster onboarding of new projects, sites, or acquisitions  

blub

Decision-making grounded in current, trusted, real-world conditions

By transforming scan data into 3D meshes to maintain high-fidelity access, navigation and asset understanding, Cintoo makes the operational side of a digital twin accessible and fully connected.

How Cintoo Helps Scale the Operational Digital Twin 

Cintoo can act as an operational hinge, combining reality-based data and 3D models with other integrated information like metadata, IoT, and analytics, enabling these layers to in place, scan data becomes a foundation for operational insight rather than a static reference: 
Metadata connected to the as-built asset in Cintoo provides identity, classification, and operational meaning.
Box Image 1
IoT and sensor data connects live and historical performance information to physical assets inside Cintoo.
Box Image 2
Documentation compared in side-by-side 2D layer against the 3D data in Cintoo ensures that manuals, inspections, and diagrams are accessible in context.
Box Image 3
Built into the platform through Power BI, analytics transform raw data into insight that supports decisions.
Box Image 4

The Foundation of Asset Intelligence Through AI-Driven Tagging and Classification

Without structured asset intelligence, organizations cannot standardize workflows, automate inspection planning, connect ERP and EAM systems, or scale insights across facilities.

Cintoo enables structured, reusable asset intelligence directly inside the 3D environment.

Teams can:
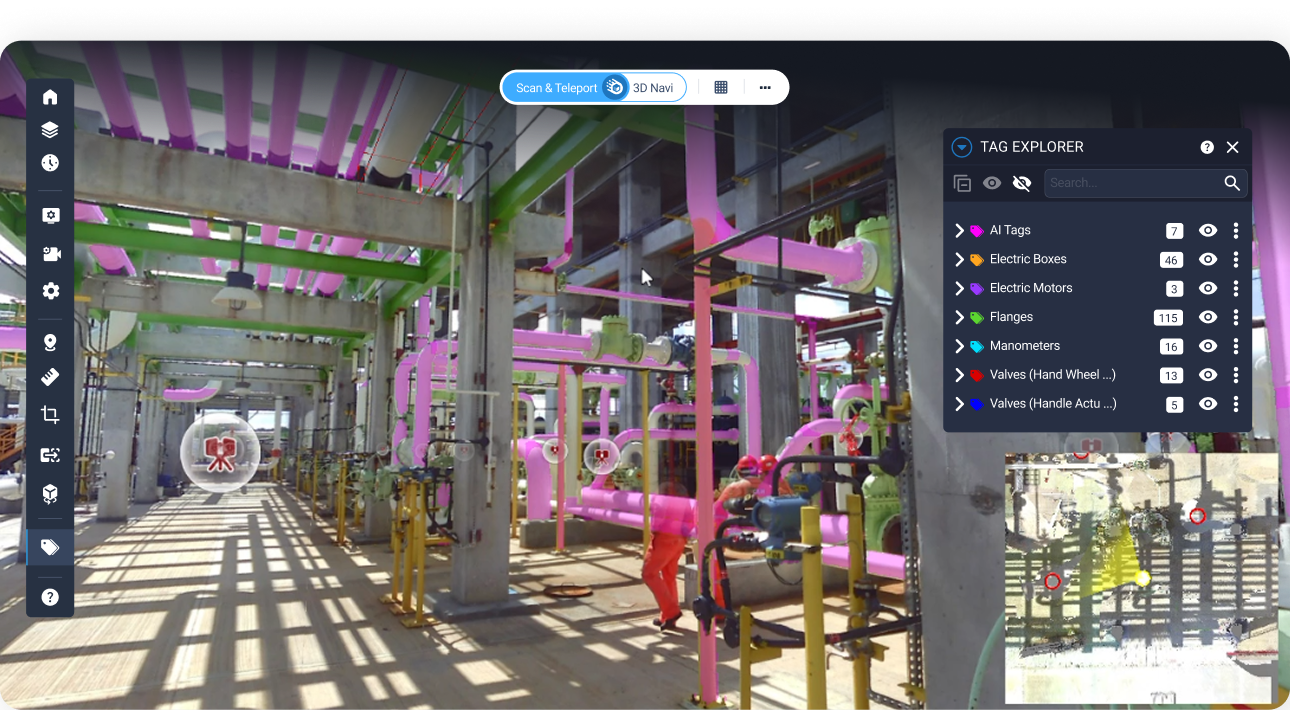
Automatically detect and classify equipment, pipes and other assets using AI
Create customizable metadata fields
Use AI-driven Click and Tag to identify and manage assets
Geolocate assets in the real-world scan
Connect asset tags to ERP, EAM, or Digital Twin platforms through linking
list-Image-feature

This creates a portable, extensible asset data model that evolves with operational maturity and allows enterprise teams to understand, manage and contextualize assets.

Proactive Operational Insight

Moving Beyond Identification

Instead of reactive surveys and fragmented reports, operations teams gain proactive insight that can be used for downstream processes.

As digital maturity increases, asset intelligence supports higher-value workflows:

icon-image

Inspection prioritization based on risk

icon-four-img

Condition assessment in context

icon-two

Visualization of identified corrosion-prone areas

icon-three-img

Pipe routing extraction

Connecting IoT to Physical Reality

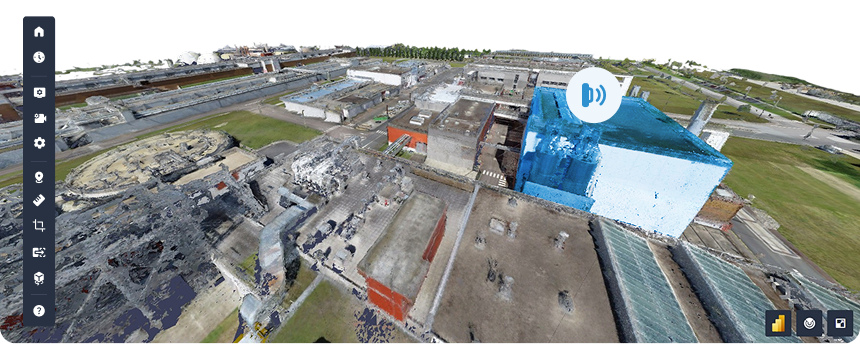
IoT systems generate enormous volumes of performance data like pressure, vibration, emissions, and battery levels. Cintoo connects IoT streams directly to asset tags within the reality-based digital twin. Now teams see not just what is happening but where. This enables: 
Remote diagnostics
Faster anomaly detection
Improved safety
Portfolio-wide monitoring
Reduced unnecessary site visits
Scaling Bottom Img

Scaling Predictive Maintenance with Cintoo

Unplanned downtime remains one of the largest cost drivers in industrial environments. Reactive maintenance has the potential to create emergencies, production disruptions, safety exposures and erosions. When scan data, asset intelligence, maintenance history, and IoT performance converge together, the digital twin provides the operational context to eliminate risks proactively. 

Scaling Icon 1

Compare current conditions to historical baselines

Scaling Icon 2

Plan interventions remotely

Scaling Icon 3

Validate asset accessibility before dispatch

Scaling Icon 4

Schedule maintenance proactively

Predictive maintenance can scale across facilities without losing site-specific detail. This helps companies avoid unexpected shutdowns or reduce planned downtimes.
Connecting Scan Data to Geospatial Environments

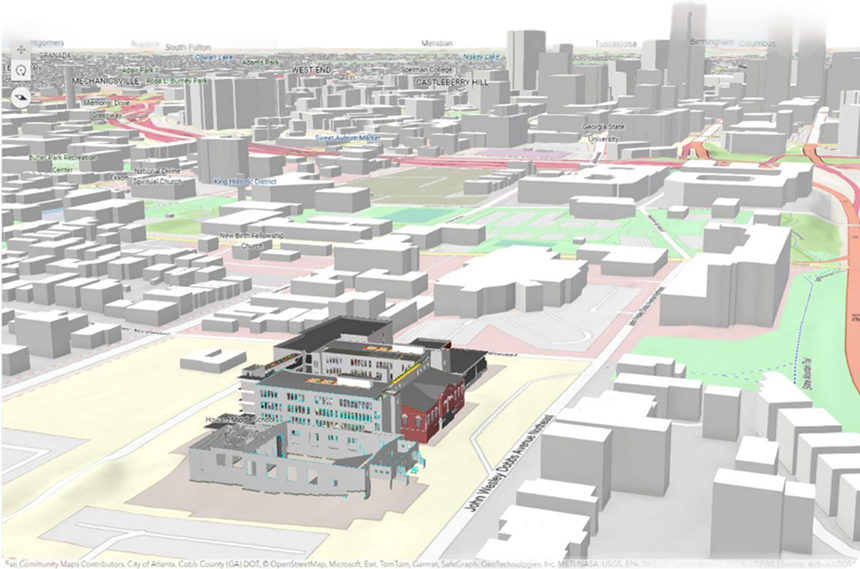
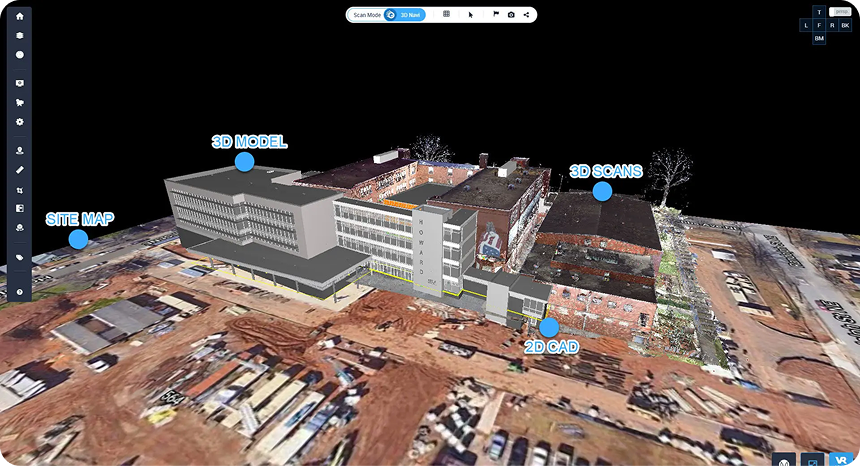
Cintoo enables GIS and reality capture data to work together by embedding “high-fidelity” scan visualization directly inside the ArcGIS environment. Through the Cintoo Experience Builder Widget, users can securely connect to their Cintoo projects from within their GIS environment and stream optimized 3D scan meshes into ArcGIS maps and web scenes. This allows laser scans and photogrammetry data to appear in their correct geospatial context alongside existing GIS layers without exporting files or leaving the GIS workflow.
EnterScale ebook Image 5 - GIS layer 1

Ensuring Connectivity Between Documentation and As-Built Conditions

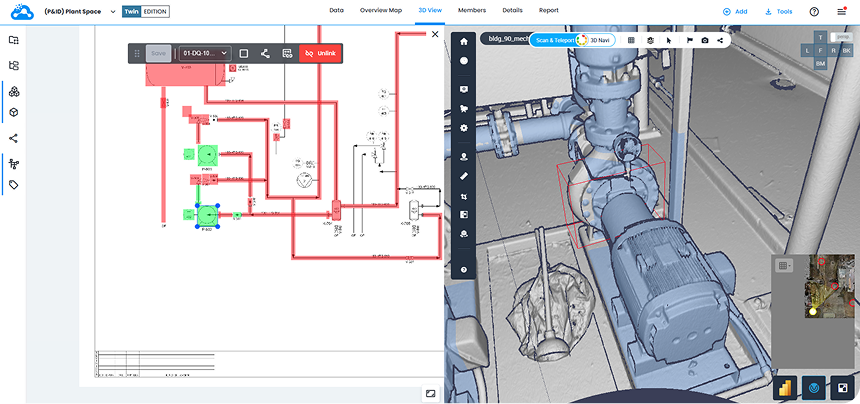
Critical documentation like P&IDs, process manuals, safety procedurals, schematics and inspection reports remains in separate systems, disconnected from the reality-based foundation. Instead of this, Cintoo powers connectivity between 3D as-built conditions and 2D documentation with its P&ID Explorer. This allows users to integrate documentation where it appears in a side-by-side view to the 3D data while still having full access to platform capabilities like BIM model comparisons. Ultimately, this helps enterprises derive more insight between their documentation and project context.
EnterScale ebook Image 5 - GIS layer 2
Using the P&ID Explorer, teams can:
 Bring BIM models into 2D processes 

 Validate pipe routing and connectivity 

 Maintain documentation accuracy over time 
 Build out assets in 2D and 3D context 
Cross-reference diagrams with as-built conditions

A New Era of Gaussian Splatting – Deployable at Scale

Cintoo’s expansion into Gaussian Splatting (360 Edition) reflects the growing demand for faster, more accessible ways to understand site context across large organizations. By converting 360 videos into immersive, photorealistic visualizations, Gaussian Splatting provides an immediate sense of space, orientation, and condition without requiring users to navigate dense point clouds or complex 3D models. This makes it especially effective for early‑stage planning and multi-use sites.

From an enterprise perspective, Gaussian Splatting is a perfectly scalable deployment model. The data is lightweight, quick to generate, and easy to stream, enabling consistent performance across locations and projects. The 360 Edition, in partnership with Ricoh’s THETA X camera, offers enterprises an easy, cost-effective way to capture their site conditions and merge 360 context to 3D data seamlessly.
 

Measuring Enterprise Value

Enterprise scalability must translate to measurable business impact. When operational digital twins are deployed across projects, organizations experience: 

Reduced rework
Fewer site visits
Fewer design mismatches
Reduced downtime
Faster RFI resolution
Shorter project cycles
Lower risk exposure

Rework Reduction

Drop in onsite rework

25% - 40%

reduction in rework-related costs

Up to

50%

QA / QC Acceleration

Faster deviation detection

30% - 60%

faster detection of construction errors

Up to

50%

Cycle Time Compression

Decision cycles shortened from weeks to hours

Faster RFI coordination

20% - 40%

Delay risk reduction

Reduction in project delay risk

10% - 30%

Financial Outcomes

ROI from scan-to-model monitoring

3-5x

Net margin recovery through better risk control

Up
to

10%

Conclusion

To put it into perspective, in using Cintoo for their operationally-driven workflows, Extropic Energy was able to optimize upstream and midstream operations to reduce site visits by 50% and cut unplanned downtime by 10–15%. By improving design coordination and supporting clash detection, Cintoo helped lower project rework and schedule delays by 20–30%. 

The Extropic Energy story is a perfect example of the ROI that becomes available when data is operationalized. By acting as a connective and actionable layer, Cintoo enables enterprises to scale project delivery across teams, facilities, and entire asset and project lifecycles. 
Conclusion Img